Part 3 in a new series
Your boss has asked you for a science-based emissions reduction target – how do you get started? This series of articles will cover what you need to know.
- Crash course in the science behind climate aligned targets
- Why science-based targets mean good business
- Quick steps to setting your targets
- How to achieve a science based target
Measuring your Emissions
Builders have a well-known saying: measure twice, cut once. It’s a simple reminder to be accurate in your preparation, so you don’t screw up the execution. The same principle applies to carbon accounting.
In order to set a science-based target (SBT), you first need to measure your full carbon inventory as it stands today. Without an accurate and properly documented baseline, you will not be able to meet the standards required to set and action an SBT.
Carbon accounting typically splits emissions into scopes based on the level of control you have over them:
- Scope 1 emissions are those you directly control, like fossil fuel combusted in your vehicles
- Scope 2 emissions are purchased energy, like electricity, where you have control over how much you use, but not necessarily over how it is generated
- Scope 3 emissions cover your wider value chain, looking at emissions from goods and services you buy, like production materials, shipping or business air travel. You have some control over how much you use and the suppliers you select, but you have less influence.
For many businesses, Scope 3 emissions make up most of their total emissions. A recent CDP report shows that for every 1 tonne of Scope 1 and 2 emissions, on average there is another 11 tonnes of Scope 3 emissions.
![Figure shows the ratio of Scope 3 to Scope 1 and 2 emissions across different industries. The number for each is the average of final ratio (Scope 3 [supply chain emissions] : Scope 1 +2 [operational emissions and direct emissions]) Retail 28.3, Apparel 25.2, Services 21.2, Food, beverage & agriculture 11.2, Biotech, health care & pharma 7.9, Manufacturing 7.7, Hospitality 6.8, Materials 4.3, Infrastructure 4.0, Transportation services 1.5, Power generation 1.1, Fossil Fuels 0.7 Figure shows the ratio of Scope 3 to Scope 1 and 2 emissions across different industries. The number for each is the average of final ratio (Scope 3 [supply chain emissions] : Scope 1 +2 [operational emissions and direct emissions]) Retail 28.3, Apparel 25.2, Services 21.2, Food, beverage & agriculture 11.2, Biotech, health care & pharma 7.9, Manufacturing 7.7, Hospitality 6.8, Materials 4.3, Infrastructure 4.0, Transportation services 1.5, Power generation 1.1, Fossil Fuels 0.7](https://cdn.sanity.io/images/m5i34srd/production/be8d9375d2569e72c803ec015c31677c4971d277-1056x768.png?auto=format&fit=max&q=75&w=1056)
If Scope 3 emissions account for 40% or more of your total, then you will have to set targets for your value chain in your SBT. Standards such as the GHG Protocol Scope 3 supply chain standard provides guidance on what emission sources to include. To make this easy, our Toitū carbon programmes come with a suite of tools and guidance to measure your footprint and have been utilised by companies like NZ Post, Kathmandu and Genesis Energy.
Whichever way you measure emissions, we recommend having your footprint verified to ensure you have an accurate and complete baseline before using it to make any plans.
Where to aim
With your verified emissions inventory established, you need to set reduction targets that cover your Scope 1 and 2 emissions, and at least 67% of your Scope 3 emissions (if they meet that 40% threshold we mentioned earlier). These requirements allow for the reality that reducing emissions across all your activities, and your value chain, is not always possible. But you can target most aspects of your business. It doesn’t have to be perfect, but the key thing is to get started.
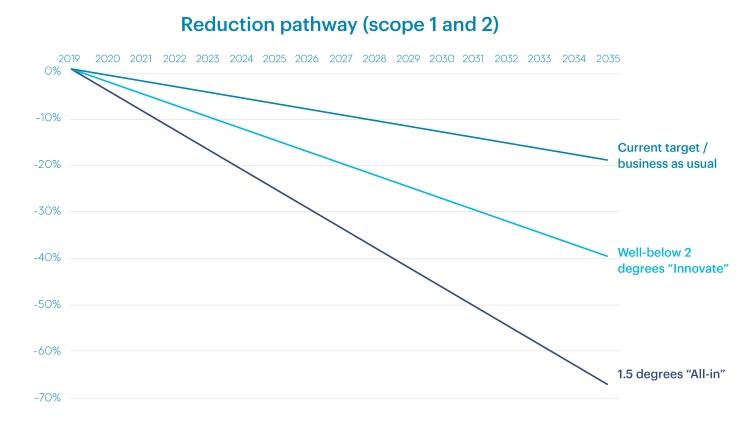
Once you have decided on the activities that need reduction targets, we can help you utilise the SBTi web tool to see overall reduction scenarios. Here we plug in your base year and target year (between 5 to 15 years out) and your Scope 1 and 2 emissions. This will give you two targets for either keeping warming well below 2° or limiting it to 1.5° - the latter being the more challenging. The tool will show you both the percent reduction and absolute total emissions of your SBT.
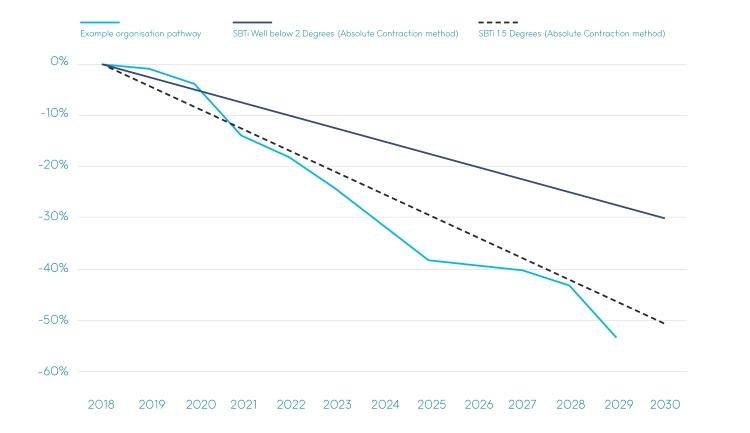
You can then plot those goals on a graph to compare it to your current reduction target pathways, if any, as well as business as usual. The graph is a great way to tell the story internally to show how and when you need to bend the curve. You can plot out consistent annual reductions across the board, or build a plan based on sharper measures in later years if, for example, you need to wait for existing leases or contracts to end before replacing your entire vehicle fleet with Electric Vehicles or investing in a solar system.
Note: Targets vs Pathways
- A target is the fixed % reduction point the company is trying to achieve by whatever target year they choose, eg. 25% reduction by 2030.
- A pathway is the entire period between your base year and target year and is the mapped out pathway (trajectory) that the organisation plans to implement in order to arrive at the target.

Figure: Example of an organisation pathway
There is no doubt that the most challenging part of this equation is your value chain. Some businesses wield quite a lot of influence on their providers, others do not. But regardless, you will need to make an assessment on how your suppliers and purchasers can help you meet your goals. This will be made easier as more businesses start taking action and reinforce each other’s value chains.
Timeframes
Whether you start with where you need to be and work backwards, or start with what you know you can do and assess the remainder, we recommend setting both long and short term goals. Be sure to plot out both your long-term goals and incremental milestones for every 5 years, to ensure your ambitions align with the overall goal.

Figure: What a reduction pathway looks like for different targets
For a more detailed talk on setting science-based standards, check out our webinar. (48 minutes)
If you plan on submitting your targets to SBTi for external validation, be sure to review their Manual and other resources (see their step by step guide to submission here).
We can help
This might all sound rather daunting, but our expert advisors can help you assess where you are now and map out a reduction pathway aligned with climate science. Let us help.
You don’t have to take our word for our expertise – we’re actually the first (and currently only) CDP-accredited science-based targets partner in Australia and New Zealand. We’ve helped many companies set their SBT already, with more underway.

In Part 4 of this series, we look at how to get started in achieving those ambitious targets.
Want to know more?
Understanding the science behind strategic emissions reductions is just the beginning of decarbonisation. Read our other reduction stories here or:
- Speak to our experts to get support setting science-aligned targets for your operations and value chain.
- Sign up to our mailing list receive the latest in news, views and sustainability best practice tips direct to your inbox.